USER GUIDE
Patrwm is an open data sharing platform for smart towns and smart places across Wales. It collects data securely from public WiFi and Internet of Things (IoT) and other Data Sensors. It then anonymises and sorts this data and visualises it in easily understood formats such as graphs and bar charts ready for you to use and download.
We currently support and share the following metrics:
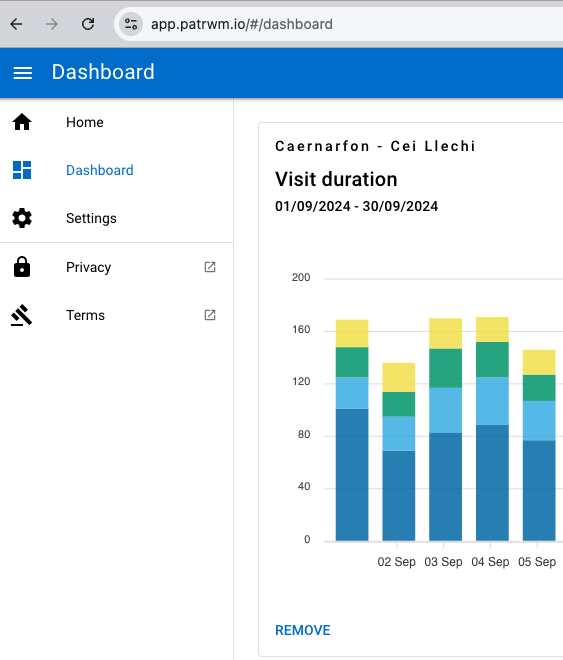
- Visit duration (the estimated number of devices that have been in the area covered by the WiFi network for more than 5 minutes, broken down into dwell times )
- Visitor count (the estimated number of devices that have been in the area covered by the WiFi network for more than 5 minutes - broken down by the time of day to the nearest 5 minute slot)
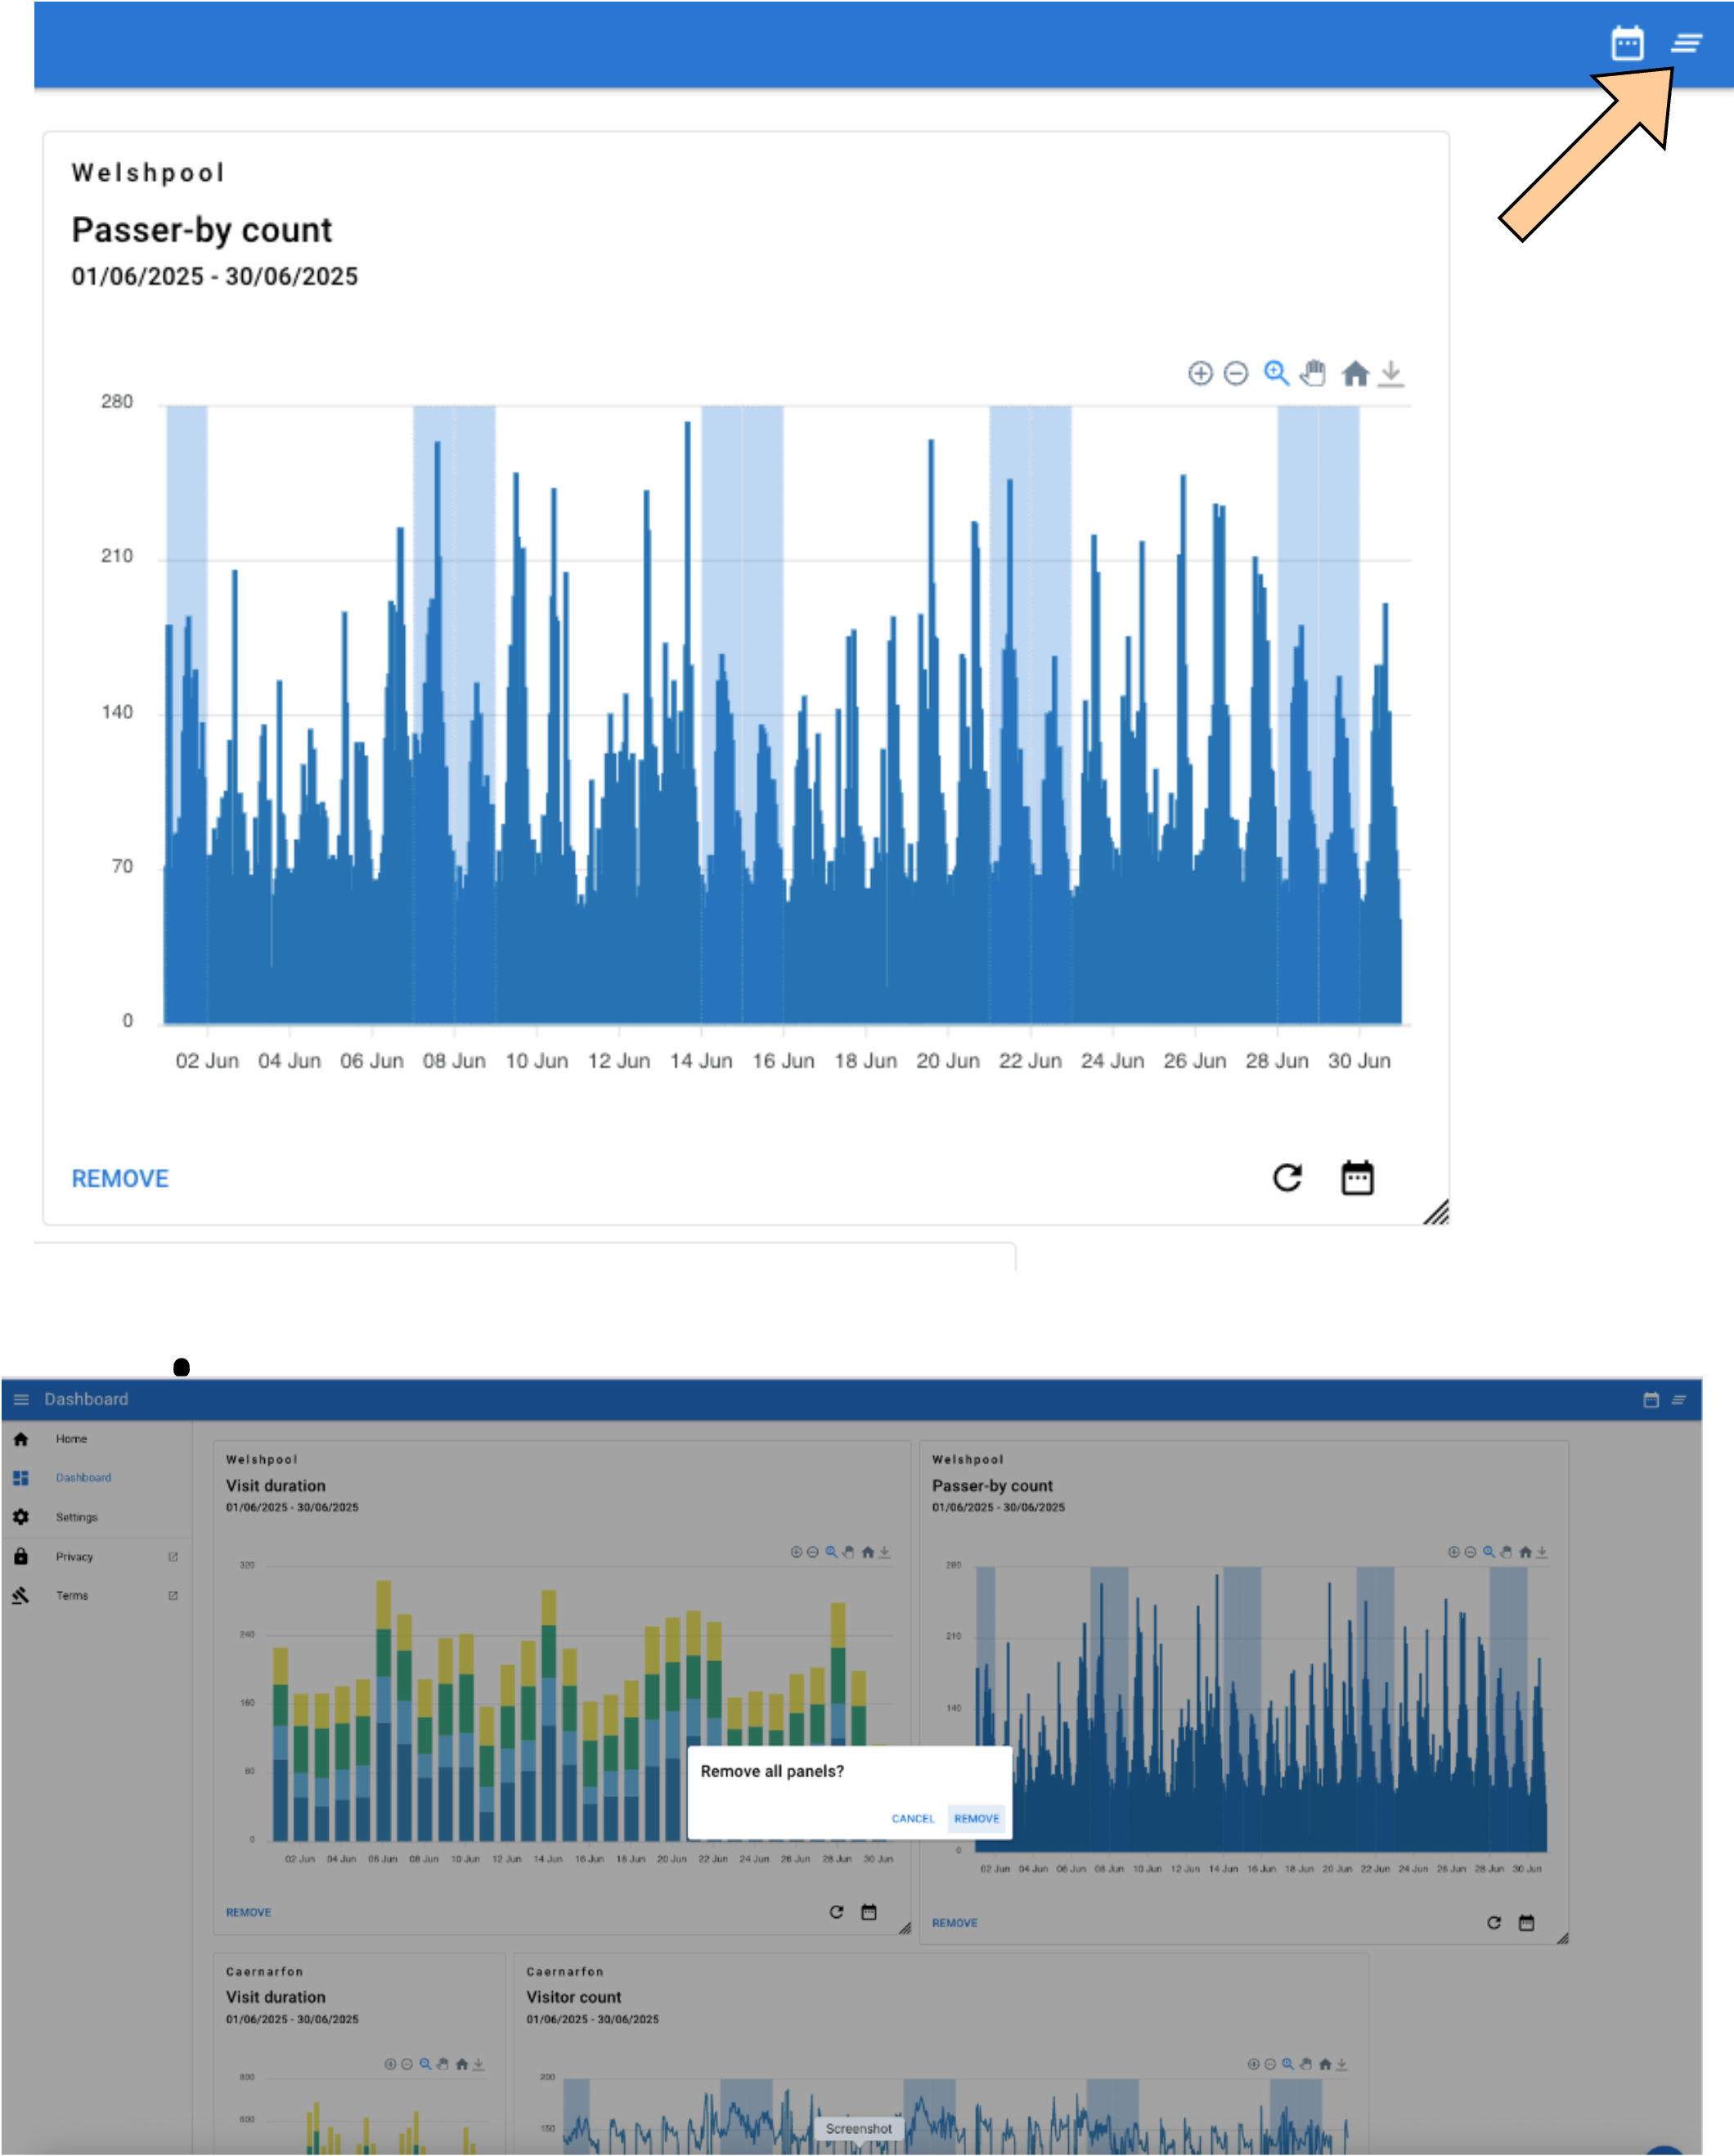
- Passer-by count (total number of devices counted - no minimum visit duration) this is broken down by the time of day i.e. if you zoom in to 13:00 the graph will display all devices counted by Patrwm within the WiFi area for that time of day - no minimum dwell period - this will be counting devices in cars passing through the WiFi network area as well as pedestrians
- Temperature
- Humidity
- Particulate levels
- Traffic volumes - using microseismology
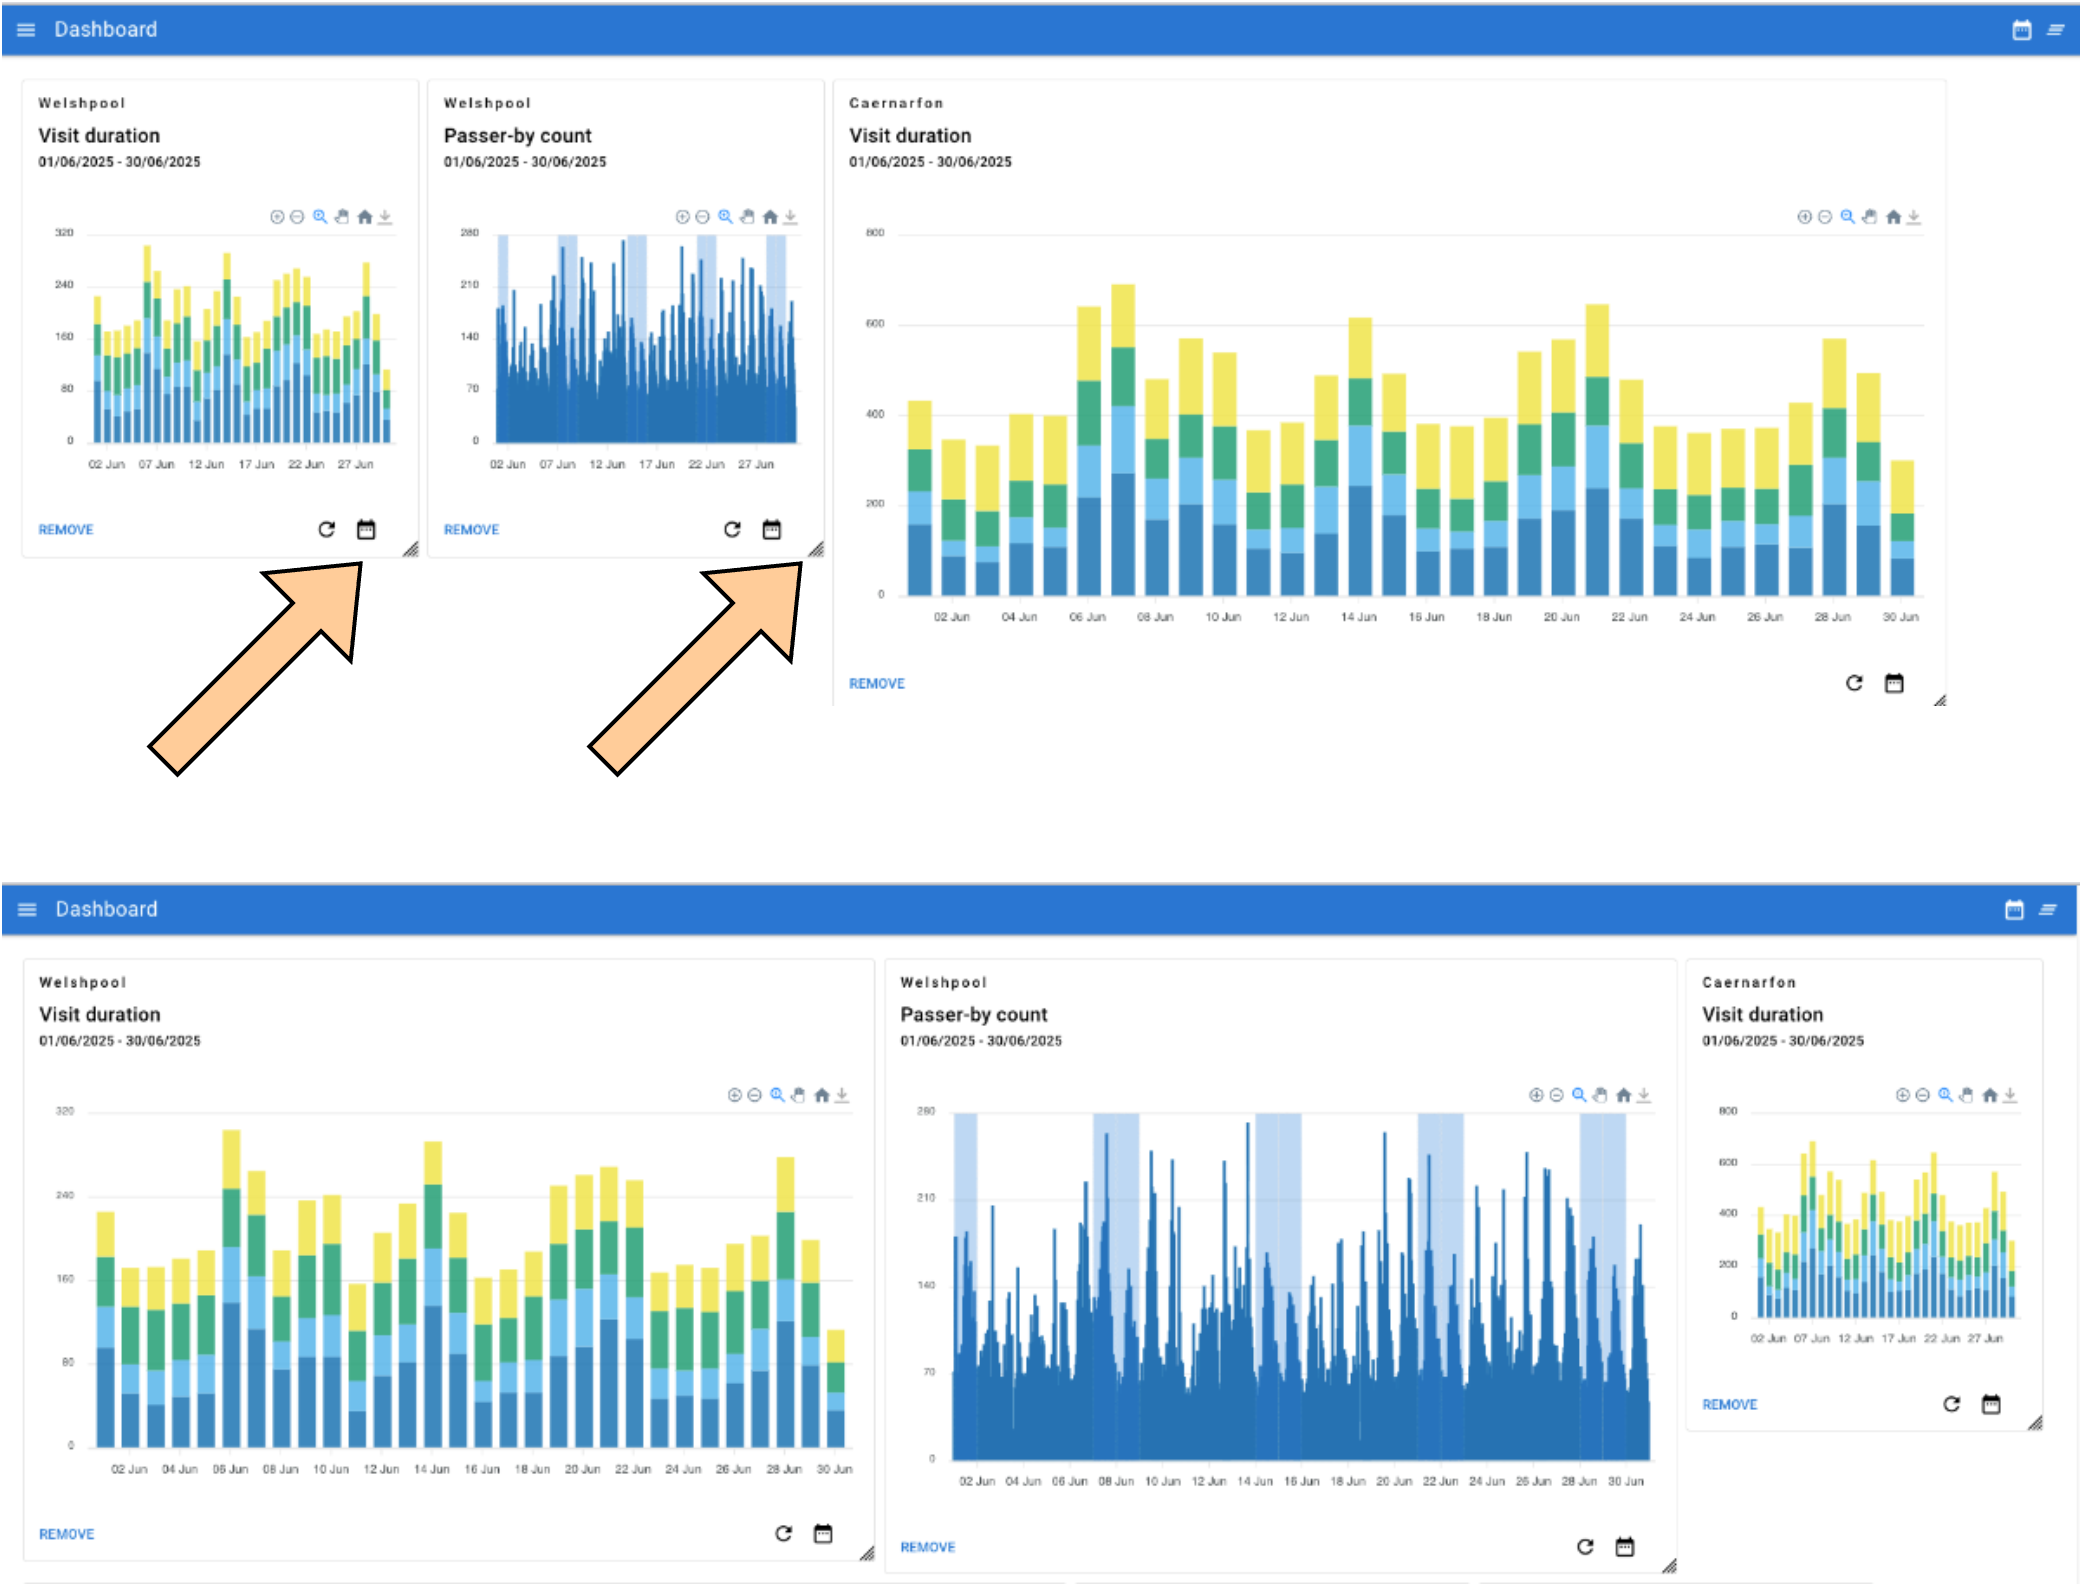
Patrwm presents each metric in its own panel i.e. the map that displays the network area map or visits per day. Change the date range by selecting the calendar at the bottom left of the panel or change the date range for all panels by selecting the calendar icon at the top right of the page (in the blue title bar).
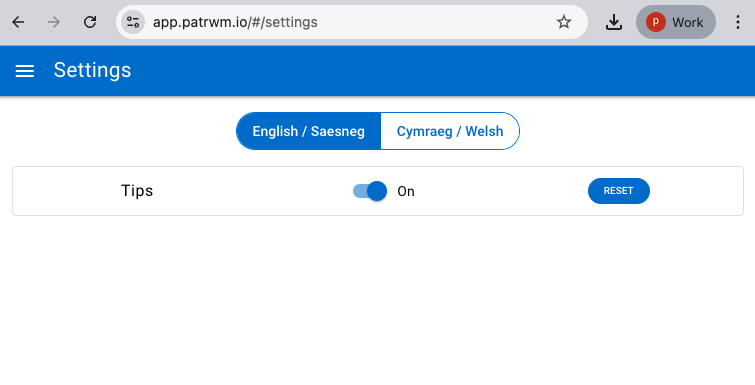
Change language from English to Welsh by selecting the Hamburger menu (3 horizontal bars) at the top left hand side of the title bar.
Build your own custom view of Patrwm’s data.
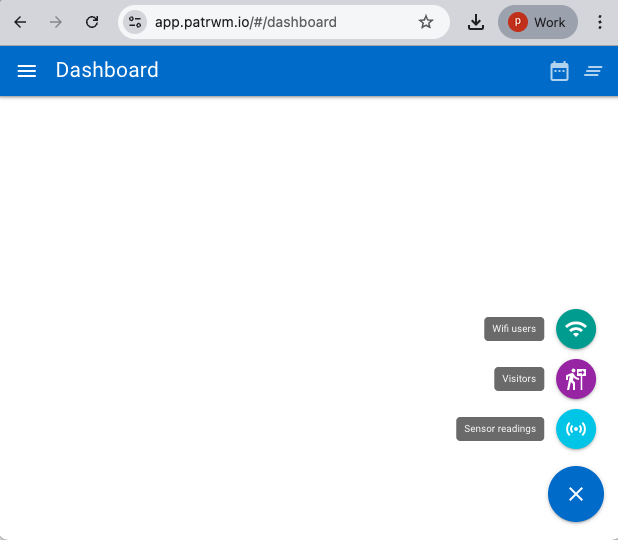
You can build your own personalsied view in Patrwm. Just select the large blue plus icon at the bottom right of your screen. This enables you to select different locations and different metrics. The next time that you visit the application on the device it will display an updated custom view based on your last selection. Compare different places across the same metric i.e. age group and gender or just build a detailed view of one place.

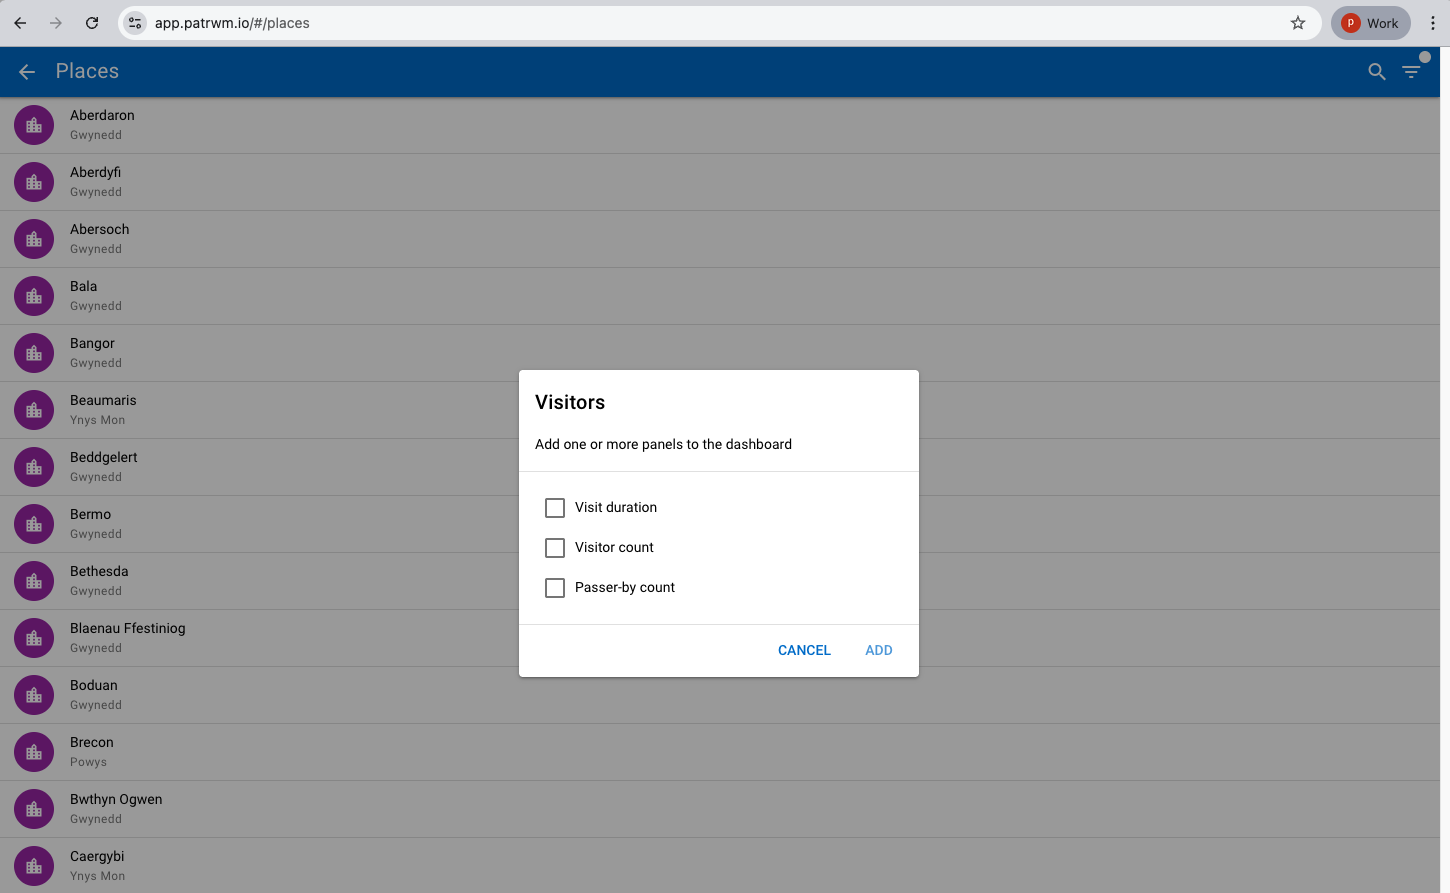
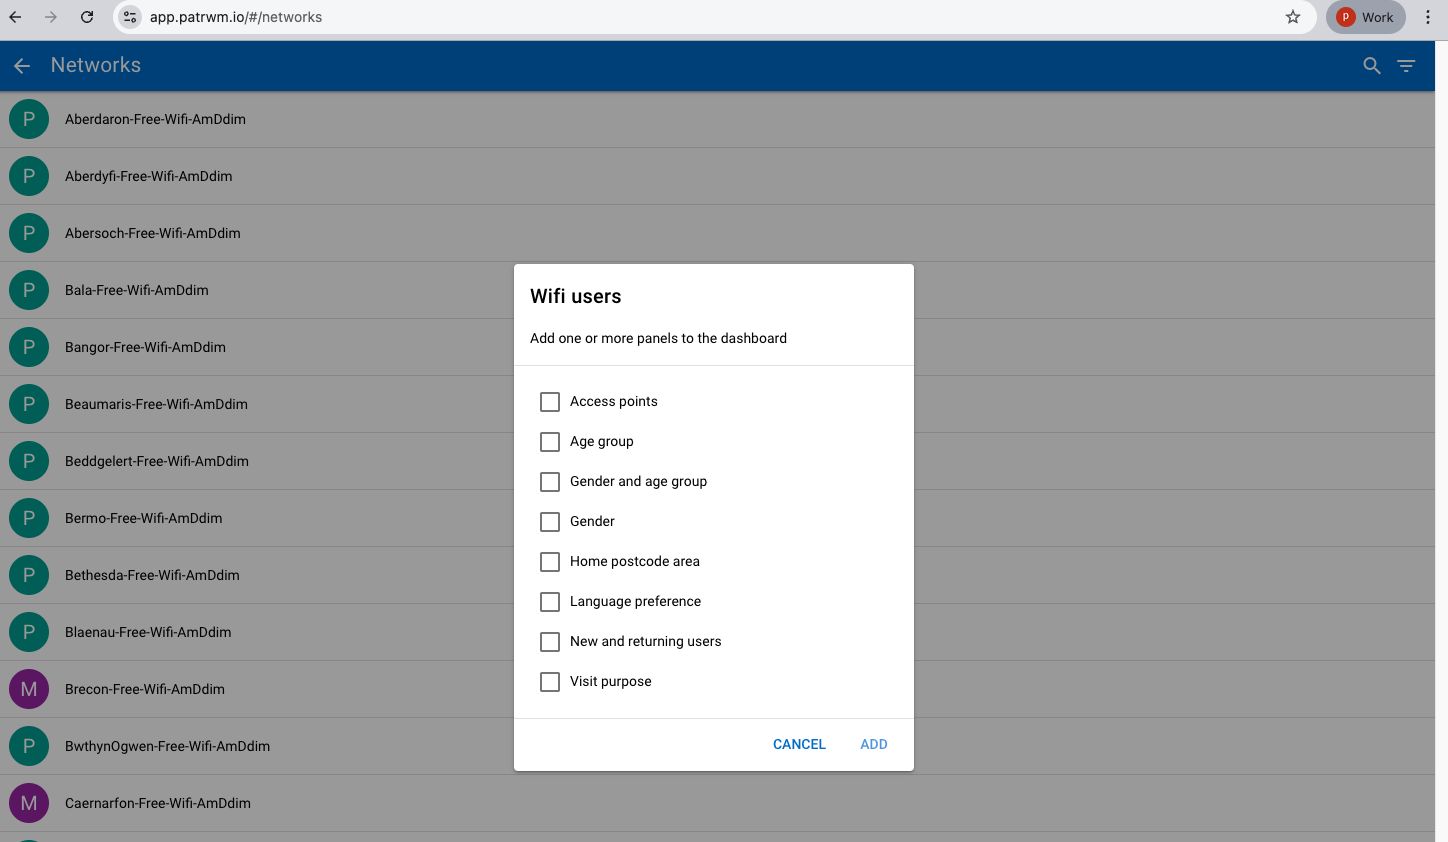
Selecting the new panel + will then ask you to confirm which type of metric you are looking for. Do you want to understand more about visitors who have logged into the network and completed the questionnaire? Select WiFi users. Do you want to learn about visitor numbers i.e. footfall. then you need to select Visitors, if you want to look at sensor data i.e. particulates, traffic then select sensors readings.
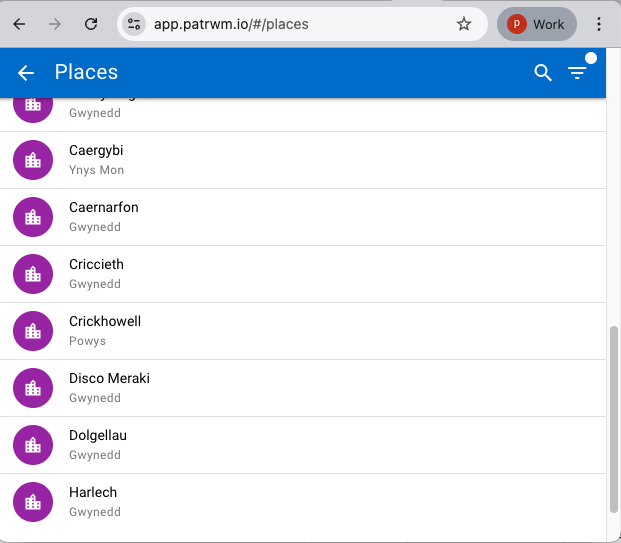
When you select the + you will be asked which smart place you want to find out more about. Select the Place from the list (you can select other smart places after you have completed this selection - just select each place by checking the circular icon in the left hand column). Once that you have selected your smart place(s) then go to the + icon in the black title bar (top far-right hand side of the page).
Once that you have selected the place(s) that you want to learn more about, you will be presented with the metrics that are grouped under the metric type. In the case of Visitors, you will be presented with Visit duration, Visitor count and passer by count, select which metrics you would like to see (note with some metrics you might need to select a short date range i.e. a week, rather than a month as there might be too much of a delay in returning larger sets of data).
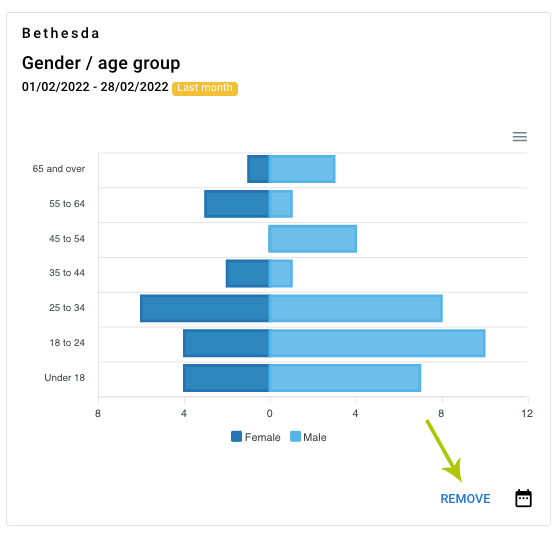
In the case of WiFI users (visitors who have logged into the network in that smart place), you will be presented with: Access points (the area covered by the network and the location of the sensors/access points), Age Group, Gender and Age Group, Gender, Home Postcode Area, Language preference, New and returning uses and visit purpose, select which metrics you would like to see displayed in panels.
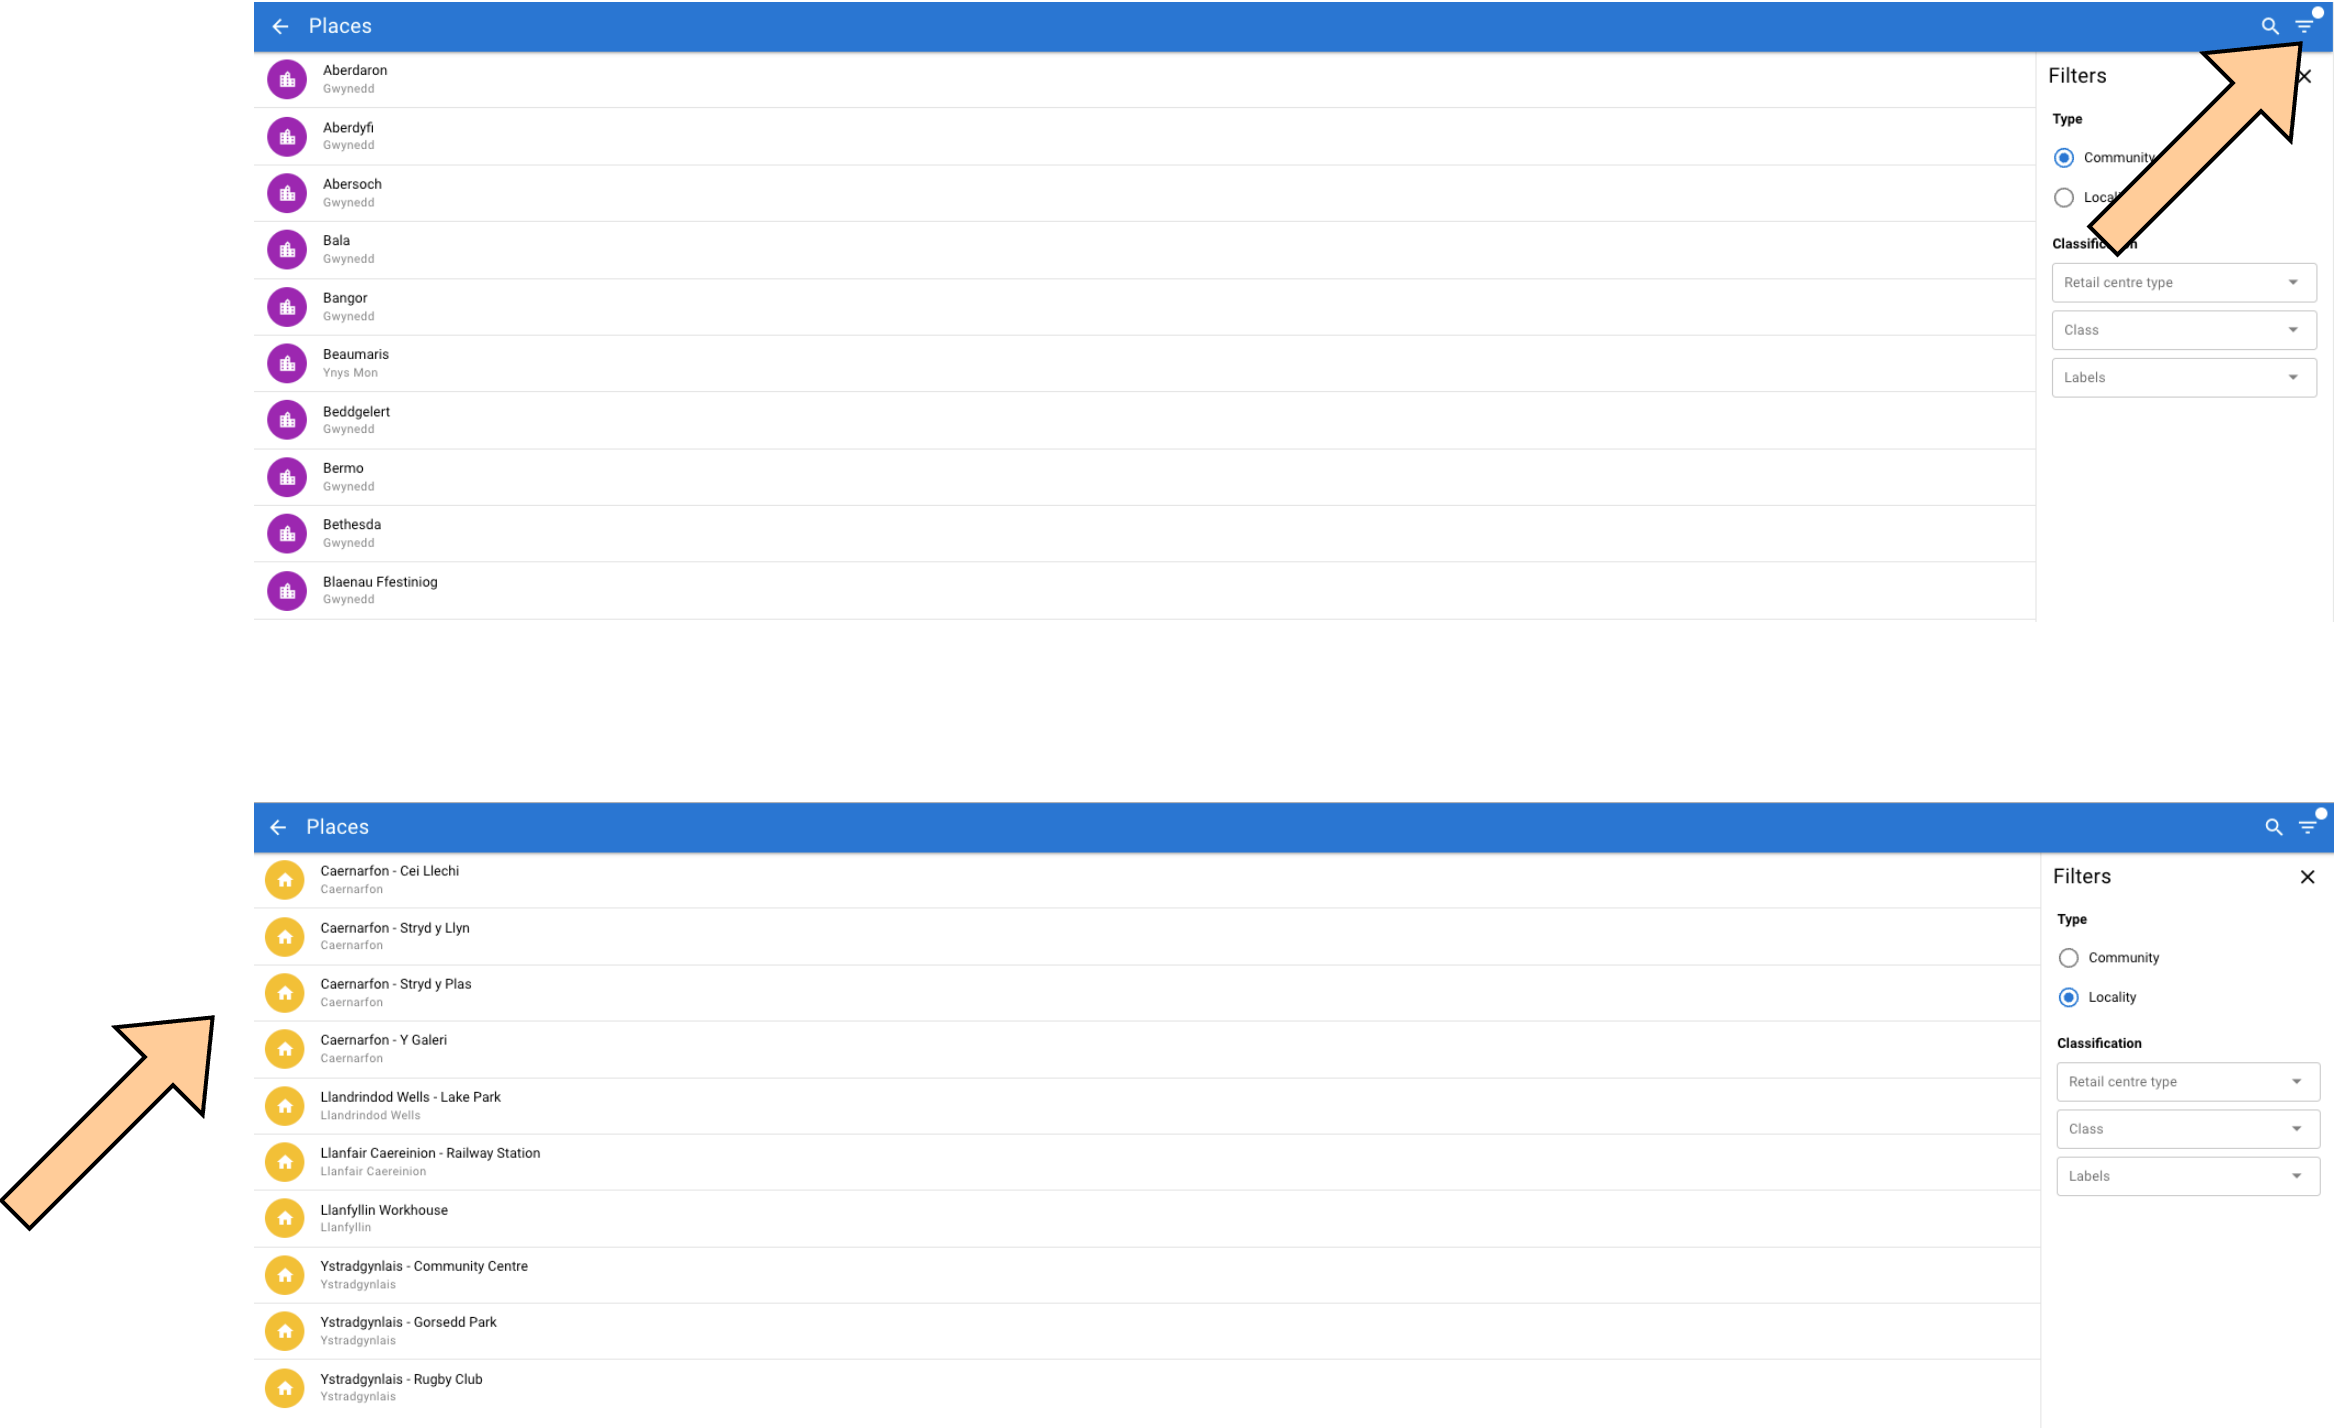
Some smart places in Patrwm have been broken down into smaller areas i.e. if a town had a jewellery quarter then Patrwm supports the creation of what we call a locality. The access points that are located in this part of the smart place can report their footfall data separately to the smart place as a whole. You are also able to filter on what type of town using commonly accepted UK classifications such as: Retail Centre Type - Holiday, Multifunctional. Speciality or Comparison. In addition to being able to filter on places via the filter menu. users can also filter based on the network type i.e. Plasmacloud/Meraki by selecting Visitors and then selecting the filter from the top right hand side of the title bar.
If you want to view sensor data then select the sensor readings. This will take you straight to the sensors that are currently integrated into patrwm - with some metrics you might need to select a short date range i.e. a week, rather than a month as there might be too much of a delay in returning larger sets of data).
Downloading and managing data.
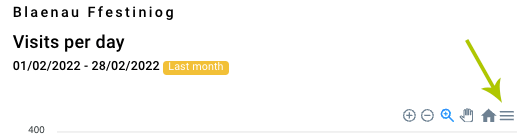
Download the data by selecting the hamburger menu (three parallel horizontal lines) on the top right of each panel. Data is downloaded as a CSV file which can be easily imported into a spreadsheet or database. You can also export the panels as graphics for use in reports or emails.
Clear the page and start afresh by selecting the oblique hamburger menu in the top right hand of the title bar.
To add another panel select the blue + sign at the bottom left of the screen. You will be presented with a list of the locations that have Patrwm. Select the blue circle next to the place name and a drop down menu appears with all of the options. Select the options and then select ADD. To add more panels just select the big blue + at the bottom right of the screen.
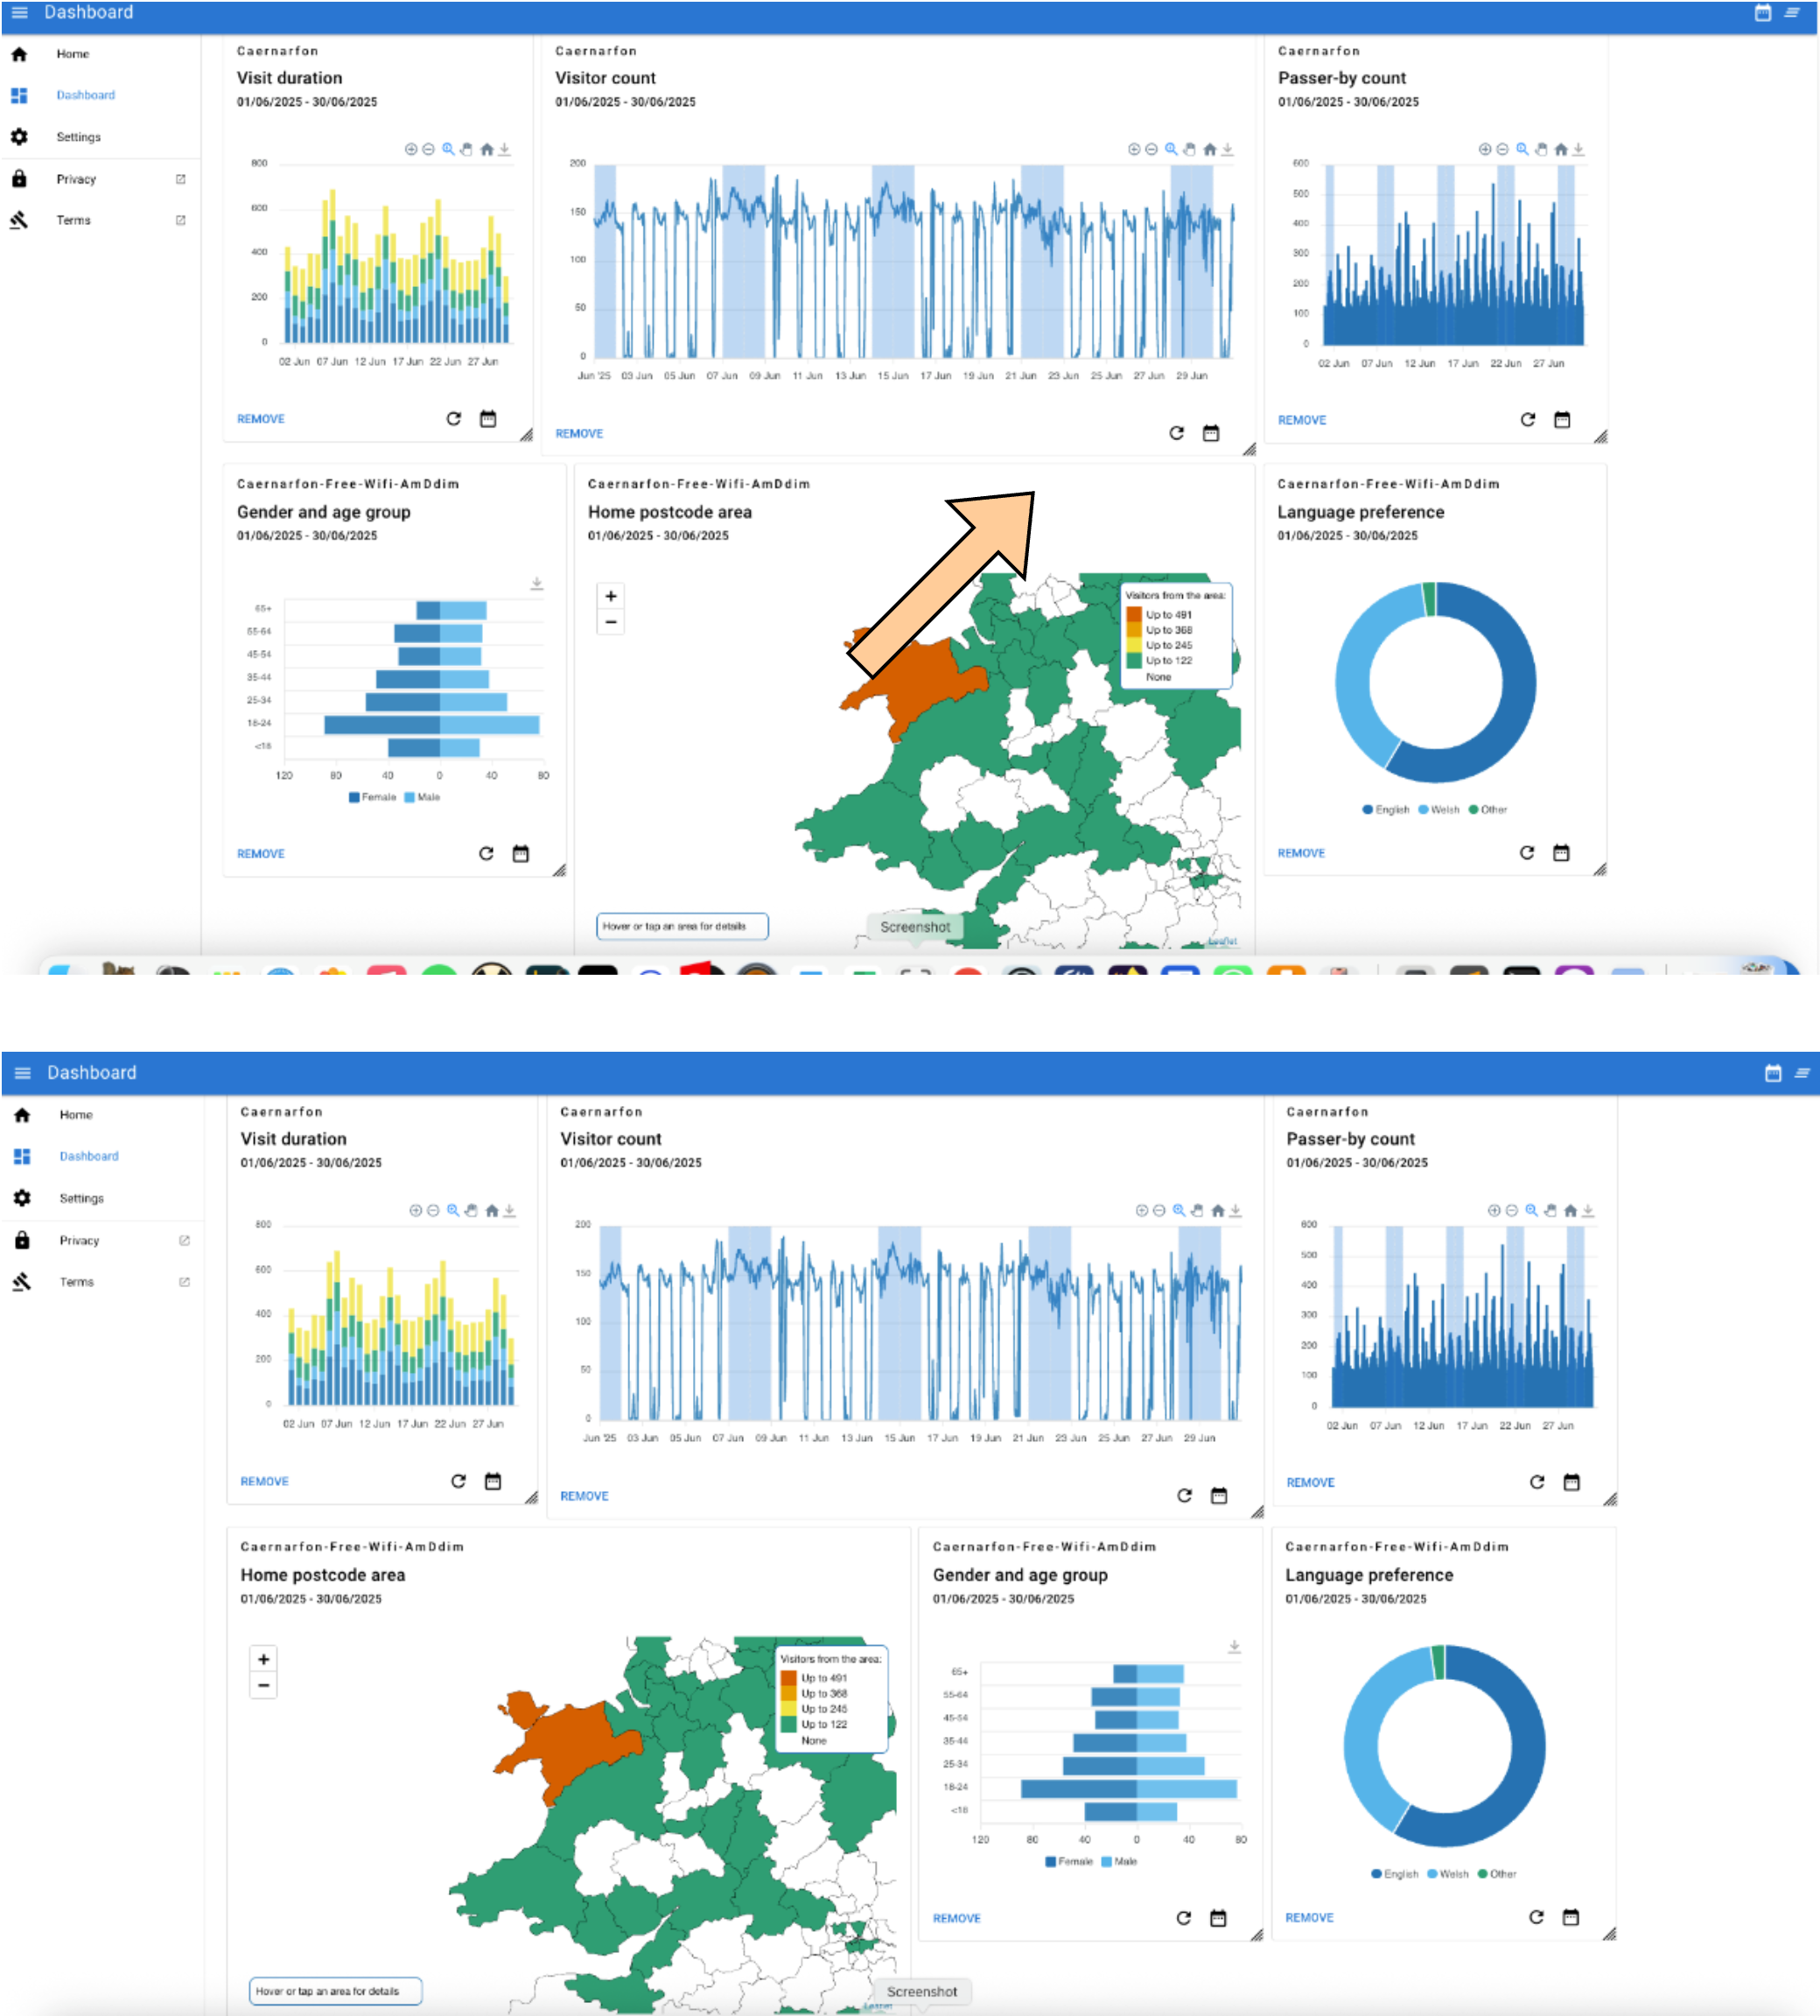
To remove a panel select REMOVE at the bottom right of the panel.
If you want to rearrange the layout of panels on the page all you have to do is move your cursor onto the top of the card and drag in the direction that you want it to be. Remember that there needs to be a space i.e. drag and let go when your cursor is over the gap between the cards or edge of the page.
If you want to change size of a panel on the page -select the bottom right hand corner of the panel (it looks like it has a fold on it) and dragging the panel into its new shape/size.
DATA COLLECTION BY PORTH
Porth is our secure bilingual WiFi login portal. We ask visitors who sign into the free WiFi to answer five questions and this information is collated and visualised by Patrwm.
From the Porth WiFi login portal we collect data for each smart town or smart place. These are the five questions that the WiFi users are asked:
- Age range (e.g. 25-34)
- Gender
- Purpose of visit (select from a list)
- Preferred language (so that we communicate with them in their language of choice, Welsh or English)
- Home post code area (e.g. LL57)
- Returning visitors - the proportion of visitors that sign in more than once in a period of 3 months.
We collect the user’s email address with their confirmation that they accept the terms and conditions of usage and that they have consented that their personal information can be processed by Menter Môn and it’s partners.
We then aggregate this data for each day and send it from Porth to Patrwm to display against each location. All data from Porth is anonymised before it goes to Patrwm.
No personal information forms part of the aggregated data.
COUNTING FOOTFALL NUMBERS
Patrwm uses data recorded by our WiFi access points that are installed in each smart place.
All digital mobile devices, when not already connected to a WiFi network, are broadcasting discrete messages declaring their unique id (called a mac address). This is how your device connects instantly to your WiFi when you get home. Your device is saying “Hi my name is XYZ123” when you arrive home your WiFi router recognises this and promptly connects the device.
When you are out and about and not connected this is what your device is doing. We collect these randomised Mac Addresses and then randomise them using a process called hashing and salting - which makes the process secure and Patrwm cannot get back the original mac address.
At the end of the day Patrwm totals up how long this device was in the network. If the hashed and salted ID stayed in a smart town network for 37 minutes we would then add this to the 30-60 minute count.
When we finish aggregating the hashed and salted addresses that day’s data is deleted and Patrwm just keeps the final totals/counts. This helps us ensure that we do not hold any data that might be deemed as personal for any longer than is required in order for us to process it. We do not keep any backups of the raw, hashed and salted data. Only the processed aggregated data is backed up.
Patrwm displays data from yesterday back to when the network was originally installed. Today’s footfall data will be available to view tomorrow.
Counting the number of devices is not the same as counting the number of people, but it is a good indication to help better understand patterns of activity in an area over time and during the course of a day.
Please note the gender breakdown does not necessarily match the footfall data, but it can give a useful indication.
CAPTURE SENSOR DATA
We treat sensor data differently. We capture it frequently i.e. particulate data is being measured and stored in real-time every 20 seconds. We store this data in its raw format for 3 to 5 years.
At the end of each day we process the sensor data and rationalise how this is visualised so that sensor data from the last week might show down to every 5 minutes, then for every hour. The raw sensor data is stored on the cloud for future use.
Our sensors are normally battery powered and use LoRaWaN (long range wide area network) to transmit data securely back to Patrwm. Where the sensors are open source we always aim to send their data back to the original project as well as Patrwm. Our particulate and sound level sensors will always send data back to the sensor community system as well as Patrwm.
We are currently working on supporting a wider range of sensors including:
- Seismometers
- Weather sensors
- Sound level sensors
- Parking sensors